Exploratory Data Analysis with Python

A walkthrough of a simple EDA workflow using pandas and matplotlib.
Author

Jonathan Pearce

Published

February 15, 2026

Overview

This example post demonstrates how a typical Exploratory Data Analysis (EDA) blog post looks on this site. It generates synthetic data so the post renders without external dependencies.
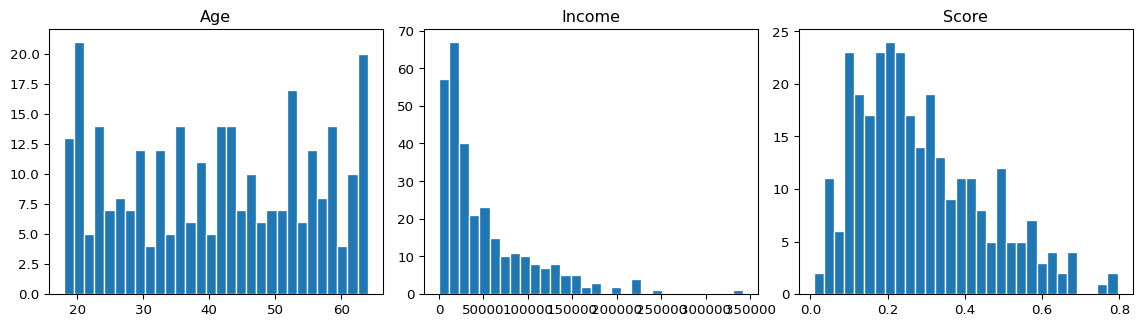
Generate Data

Code
import numpy as np
import pandas as pd
import matplotlib.pyplot as plt

np.random.seed(123)

n = 300
df = pd.DataFrame({
    "age": np.random.randint(18, 65, n),
    "income": np.random.exponential(50000, n).round(2),
    "score": np.random.beta(2, 5, n).round(4),
})
df.head()
age income score
0 63 42639.29 0.0089
1 20 5414.64 0.4655
2 46 60170.99 0.2125
3 52 54112.52 0.1904
4 56 2517.17 0.2594

Distributions

Code
fig, axes = plt.subplots(1, 3, figsize=(12, 3.5))
for ax, col in zip(axes, df.columns):
    ax.hist(df[col], bins=30, edgecolor="white")
    ax.set_title(col.capitalize())
fig.tight_layout()
plt.show()
Figure 1: Distribution of age, income, and score.

Correlations

Code
df.corr().round(3)
age income score
age 1.000 0.096 0.012
income 0.096 1.000 -0.077
score 0.012 -0.077 1.000

Next Steps

  • Handle outliers
  • Feature engineering
  • Modelling